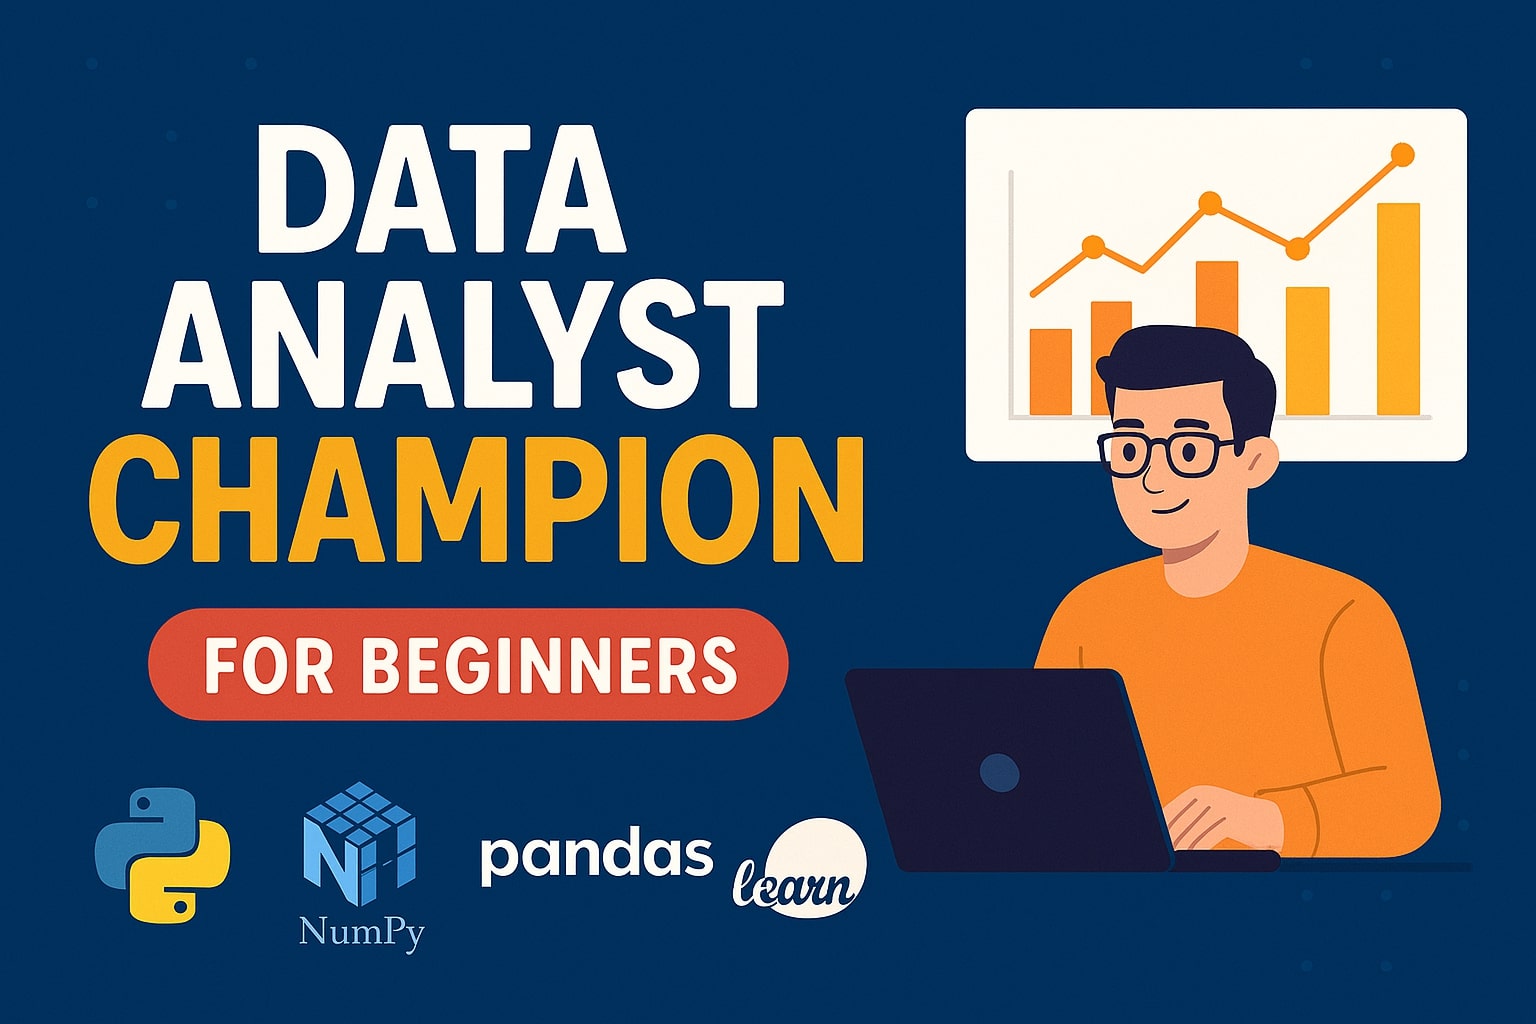
Data Analyst Champion
Become a job-ready data analyst: clean data, build dashboards, run analyses and present insights that drive decisions.
- Python & Libraries: Pandas, NumPy, Matplotlib
- SQL for Analytics: Joins, window functions, aggregation
- EDA & Visualization: Storytelling with charts & dashboards
- Statistics & A/B Testing: Practical hypothesis testing
- Tools: Tableau, SQL Server, AWS basics
Core Tools & Technologies
Python
Programming Language
NumPy
Numerical Computing Library
Pandas
Data Analysis Library
Jupyter
Interactive Notebooks
Matplotlib
Data Visualization Library
Scikit-Learn
Machine Learning Library
SQL Server
Database & Query Language

Tableau
Business Intelligence Tool
AWS
Cloud Platform
About Data Analytics
Data analytics is the process of inspecting, cleansing, transforming, and modeling data to discover useful information, inform conclusions and support decision-making. Our Data Analyst Champion programme focuses on practical, industry-facing skills so you can contribute to real teams from day one.

Industry Professional Led Sessions
Get guidance from qualified industry professionals who bring real-world context and use-cases to every lesson.
Project Portfolio
Start building a job-ready profile with a dynamic project portfolio that demonstrates practical skills to employers.
Career Assistance
Prepare for interviews with dedicated guidance and opportunities to showcase your skills to hiring partners.
Dedicated Peer Network
Build connections with like-minded learners to exchange ideas, collaborate on projects, and grow your professional network.
Learn Industry Skills
Fast-track your upskilling journey with industry-relevant skills, hands-on coaching, and personalised guidance.
Exclusive Course Offerings
A curated set of features and supports designed to make you job-ready and confident as a data professional.

Industry-Oriented Curriculum
Curriculum designed around tasks and tools used in actual data teams.
Comprehensive Learning Content
Complete modules, readings and hands-on labs covering core analytics topics.

Weekend Live Sessions
Interactive live workshops scheduled on weekends for working professionals.
Capstone Project
A final, industry-grade capstone that synthesizes the skills you've learned.

Practice Exercises
Problem sets and notebooks to reinforce coding and analysis skills.

Assignments and Projects
Weekly assignments and multi-stage projects that mirror workplace tasks.

Live Doubt Resolution Sessions
Regular live sessions to clear doubts and walk through challenging problems.

SME Support Session
Subject matter experts available for deep-dive sessions on specialized topics.

Career Guidance & Interview Preparation
Mock interviews, resume reviews and employer-facing project showcases.

Email Support
Ongoing email support for course queries and follow-up guidance.

Peer Networking
Connect with cohorts, collaborate on projects and grow your professional circle.
Data Analyst — Modules covered
- What is Data Analytics?
- Types of Analytics: Descriptive, Diagnostic, Predictive, Prescriptive
- Role of a Data Analyst in organizations
- Analytics workflow: From raw data to insights
- Tools overview: Excel, SQL, Python, BI tools
- Data entry, formatting, and cleaning in Excel
- Formulas, functions (VLOOKUP, INDEX-MATCH, IF, etc.)
- Pivot Tables & Pivot Charts
- Conditional formatting
- Data visualization basics in Excel
- Introduction to Power Query & Power Pivot
- Descriptive statistics: Mean, Median, Mode, Variance, Standard Deviation
- Probability concepts: Independent & dependent events
- Probability distributions: Normal, Binomial, Poisson
- Hypothesis testing (t-test, chi-square, ANOVA)
- Correlation & Regression basics
- Real-world applications in decision making
- Introduction to Databases & SQL
- Basic queries: SELECT, WHERE, ORDER BY, LIMIT
- Filtering with logical operators
- Aggregate functions: COUNT, SUM, AVG, MIN, MAX
- GROUP BY & HAVING
- Joins (INNER, LEFT, RIGHT, FULL OUTER)
- Subqueries & CTEs
- Window functions (ROW_NUMBER, RANK, PARTITION BY)
- Case studies with business datasets
- Python basics: Data types, loops, functions
- Working with Jupyter Notebook
- NumPy: Arrays, vectorized operations, indexing
- Pandas: Series, DataFrames, data cleaning, grouping, merging, pivoting
- Matplotlib & Seaborn: Data visualization basics
- Handling missing data & outliers
- Exploratory Data Analysis (EDA) with Python
- Principles of effective data visualization
- Choosing the right chart (bar, line, scatter, heatmap, etc.)
- Dashboard creation
- Tools: Tableau / Power BI
- Storytelling with data
- Hands-on: Create interactive dashboards
- Feature engineering & scaling
- Time-series analysis basics
- Introduction to Scikit-learn
- Linear & Logistic Regression
- Decision Trees
- Clustering (K-Means)
- Model evaluation: Accuracy, Precision, Recall, F1 Score
- Case study: Predictive modeling for business
- Introduction to Big Data concepts
- Overview of Hadoop & Spark
- Cloud platforms: AWS, GCP, Azure for Analysts
- Using BigQuery for SQL on large datasets
- Marketing analytics (customer segmentation, churn analysis)
- Sales & Revenue analytics
- Operations & Supply chain analytics
- Finance & Risk analytics
- Case studies across industries
End-to-end project combining:
- Data extraction (SQL)
- Data cleaning & wrangling (Pandas)
- Statistical analysis (Hypothesis testing, regression)
- Visualization (Tableau/Power BI)
- Business insights & storytelling
Projects you'll build
- Sales performance dashboard with actionable KPIs
- Customer segmentation and cohort analysis
- Marketing attribution and campaign analysis
Download Brochure
Get the full syllabus as a printable brochure or download a Markdown copy for quick sharing.
Data Analyst — Full Syllabus
Duration: 10–12 weeks · Mode: Live & Self-paced
Includes modules on Excel, SQL, Python, Visualization, Advanced Analytics and a Capstone Project.